Flood mapping tool (FMT) is the first tool released as part of the Web-based Spatial Decision Support System (WSDSS) to address flood-related information gaps in the currently available flood early warning and risk management systems. The FMT generates inundation maps for significant floods from 1984 till the present using open Earth data. The tool applies a water classification algorithm to 'stacks' of historical satellite imagery derived from Landsat and Sentionel-1 & 2 to reveal inundation patterns over space and time. FMT is a hindcast tool that allows the impacts of inundation on various socio-economic sectors to be analyzed.
There are three sections in this guide
- Interface overview
- Flood mapping tool operation
- Acknowledgements and further reading
Interface overview
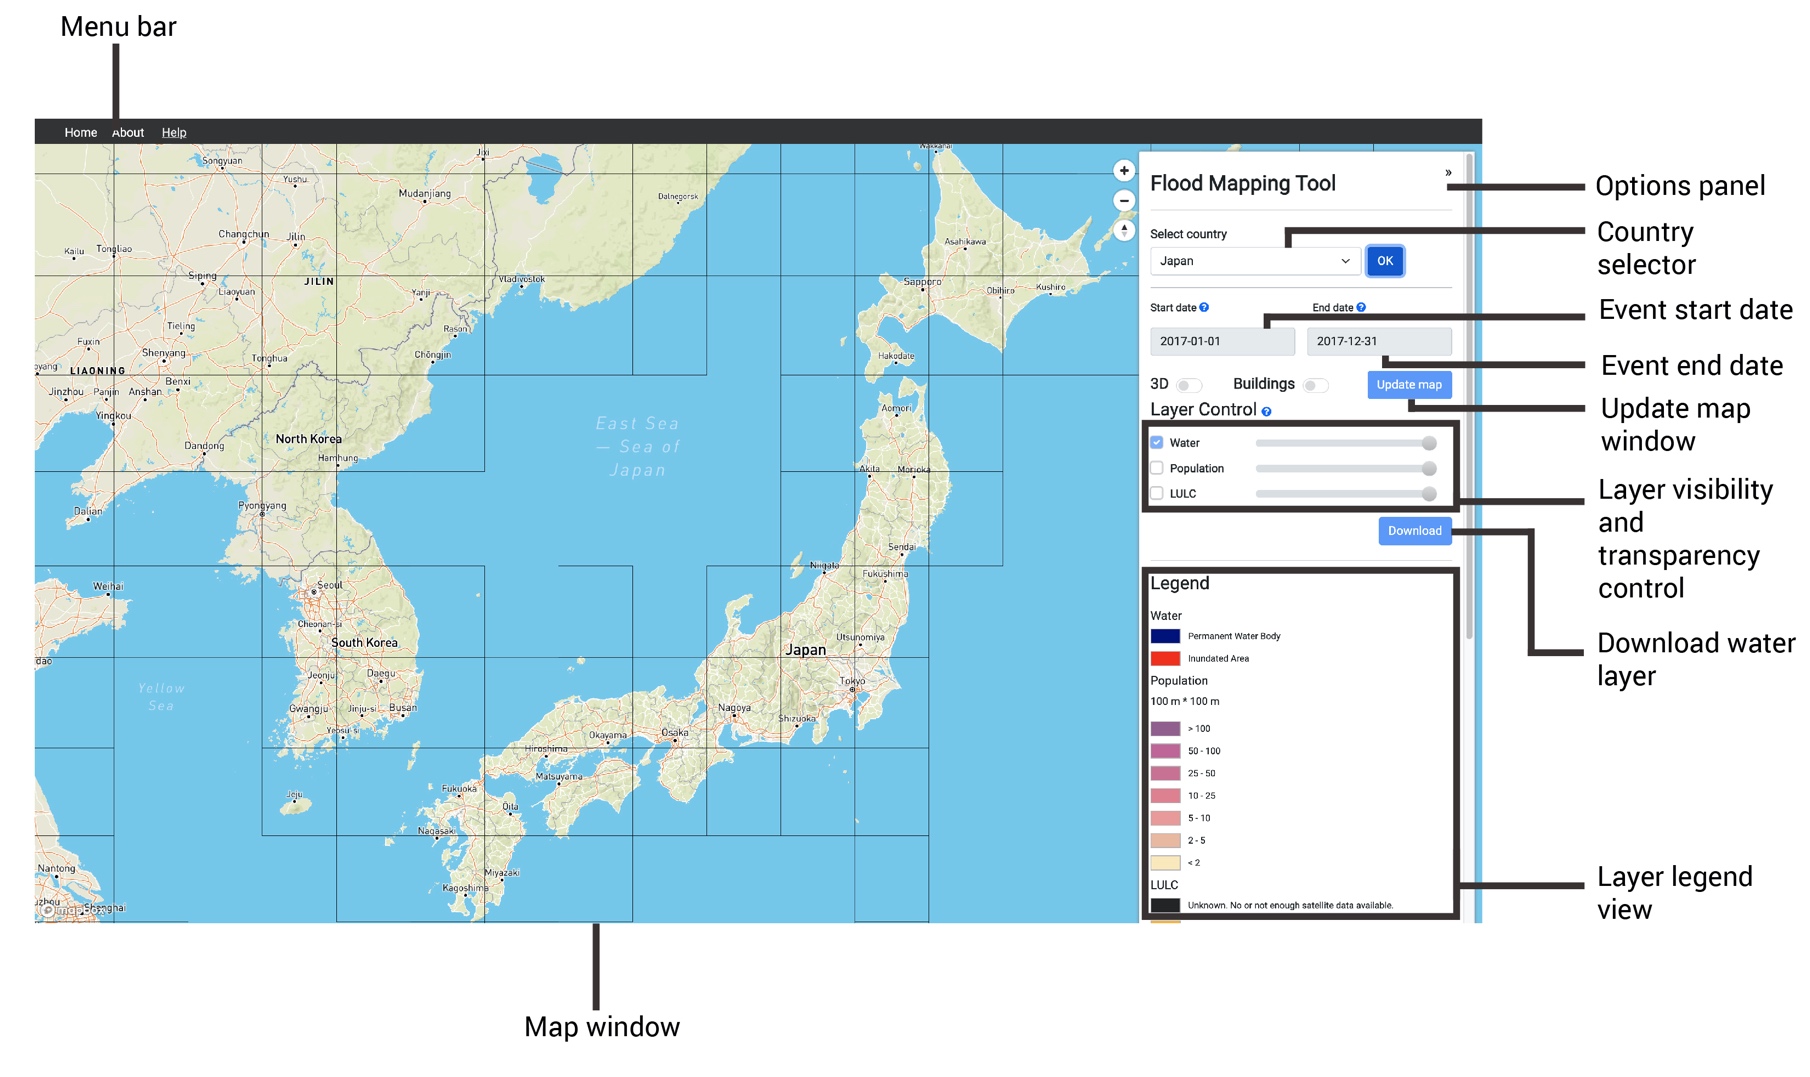
Flood mapping tool operation
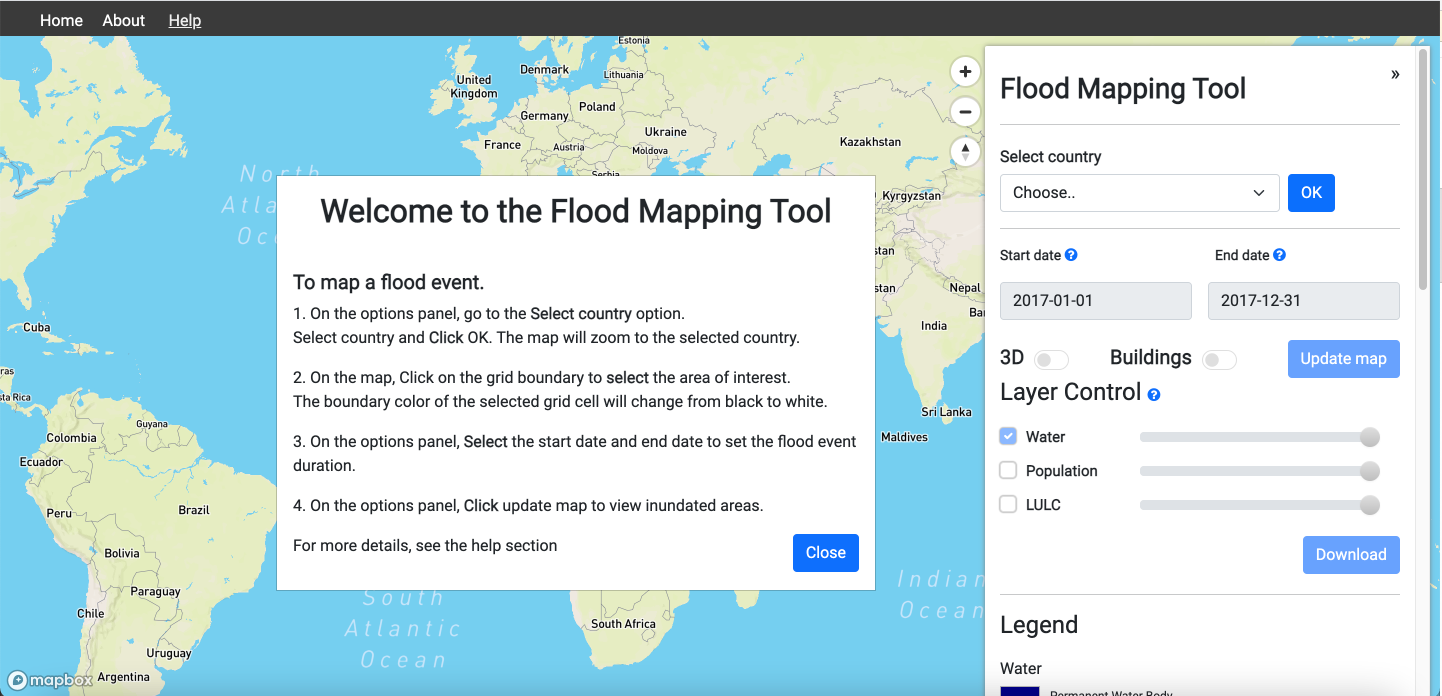
This section shows steps to operate the flood mapping tool.
1. Browse to http://161.35.38.90:5000/ to access the tool.
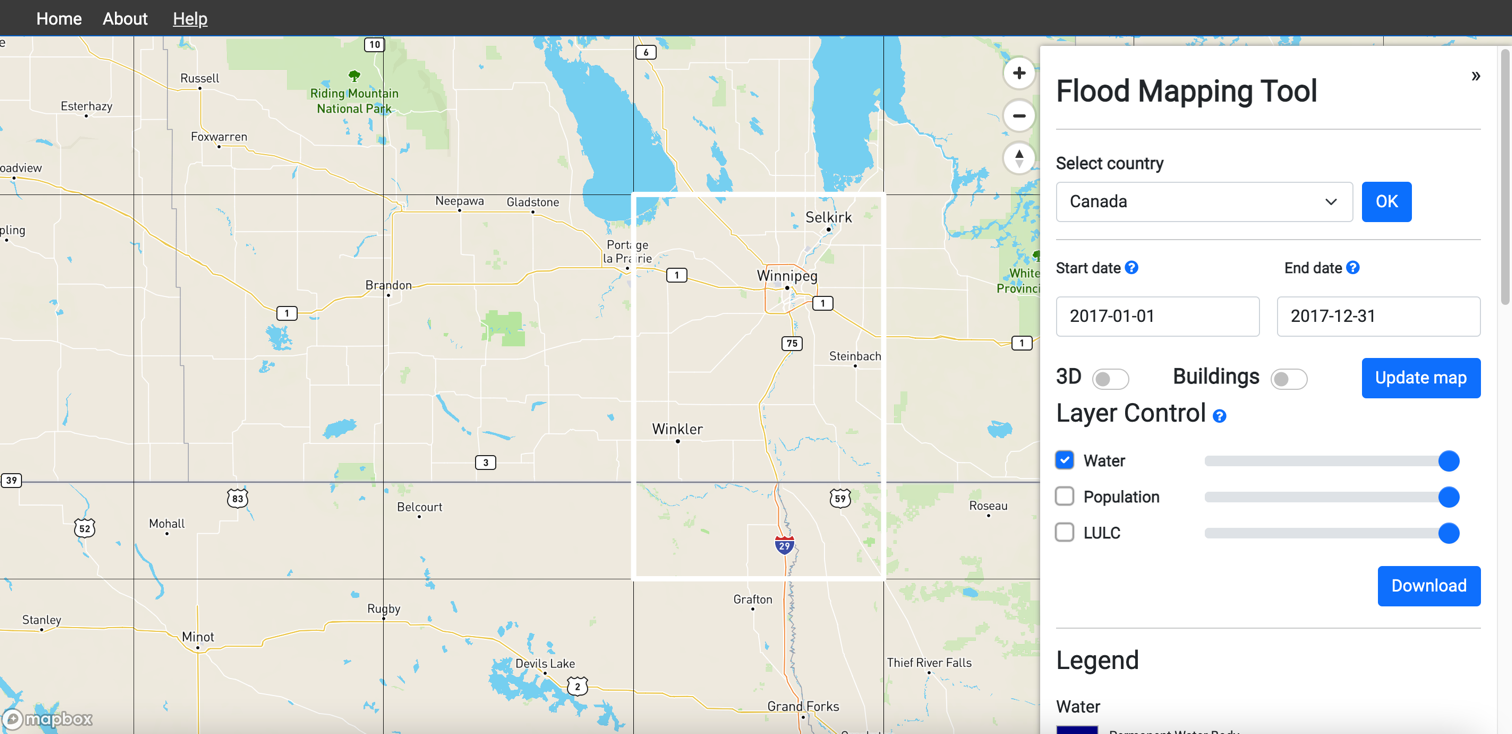
2. On the options panel, go to the Select country option.
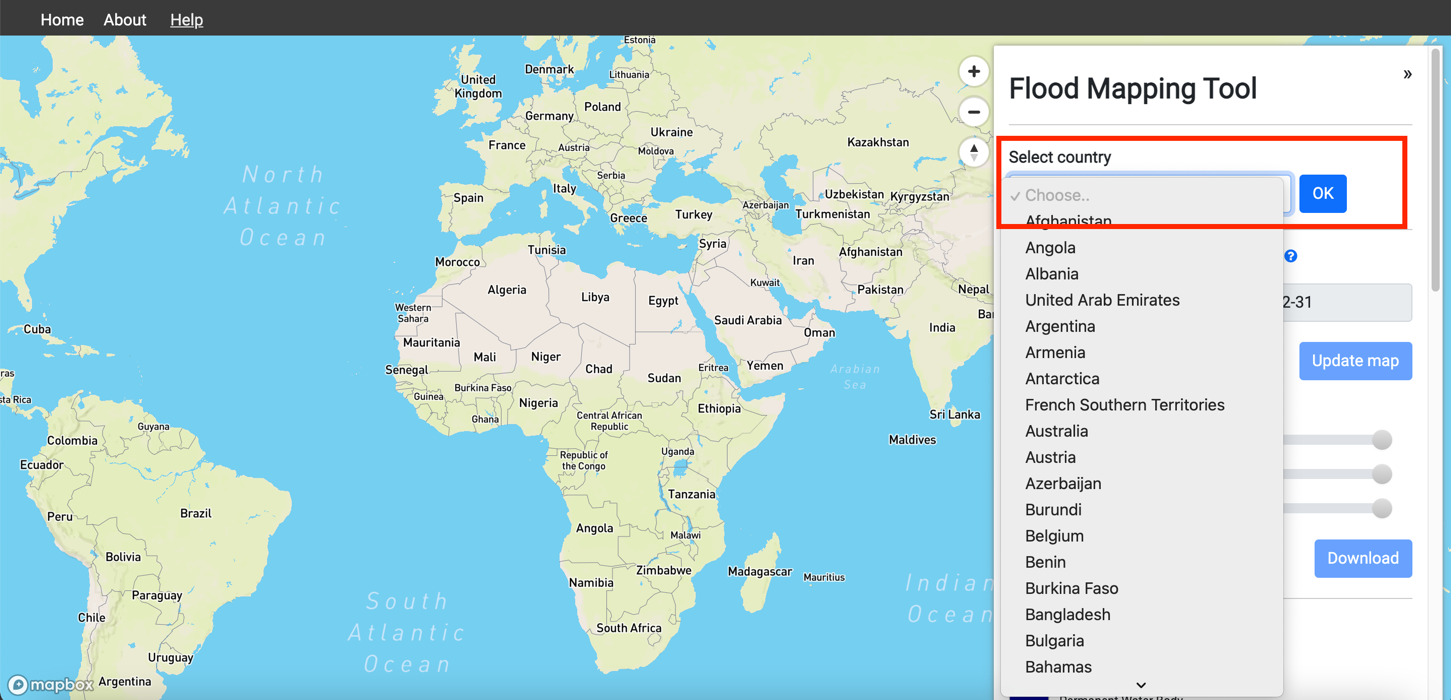
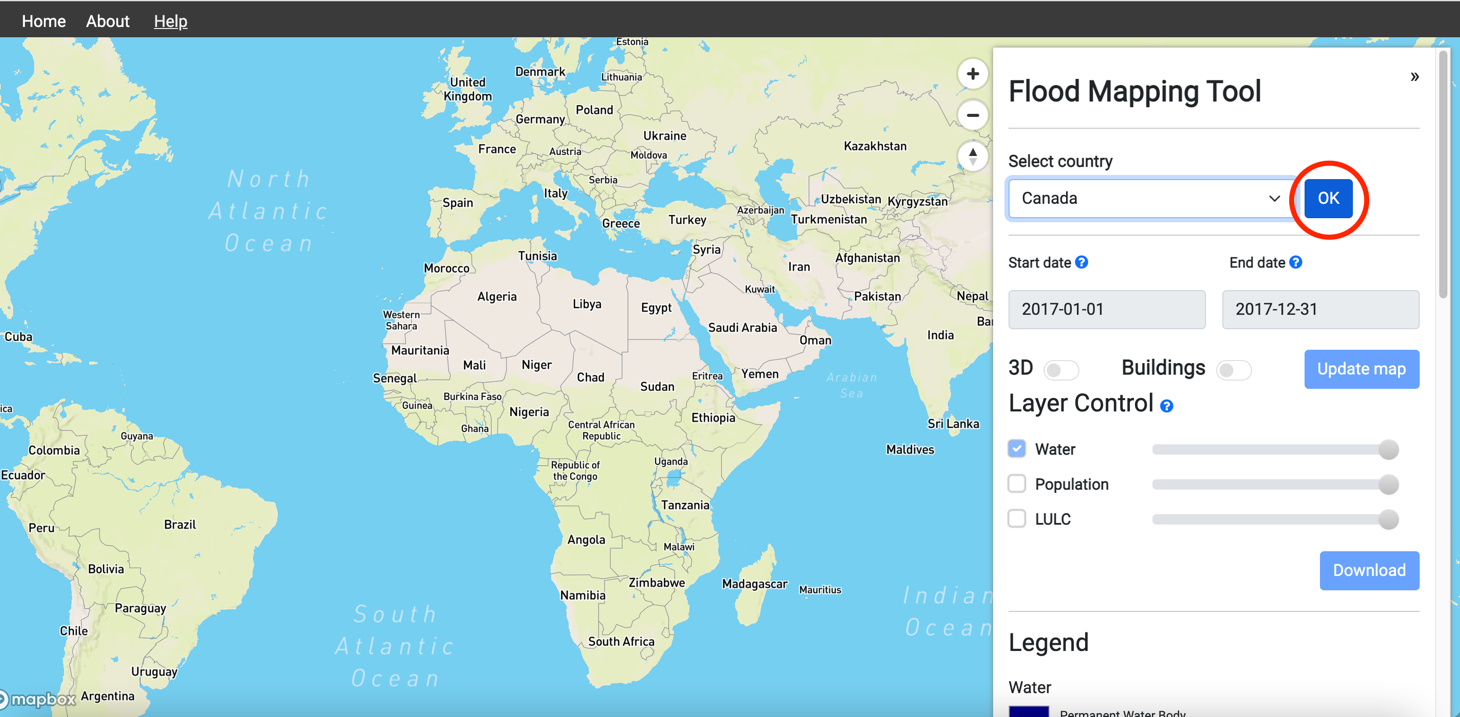
3. Select country and Click OK. The map will zoom to the selected country.
4.On the map, click on the grid boundary to select the area of interest. The boundary color of the selected grid cell will change from black to white.
5.Select the tool from the choices based on your preferred analysis:
- New real-time inundation mapping
- Time series analysis of inundated areas
- Flood frequency analysis
Proceeding with the selected tool: New real-time inundation mapping
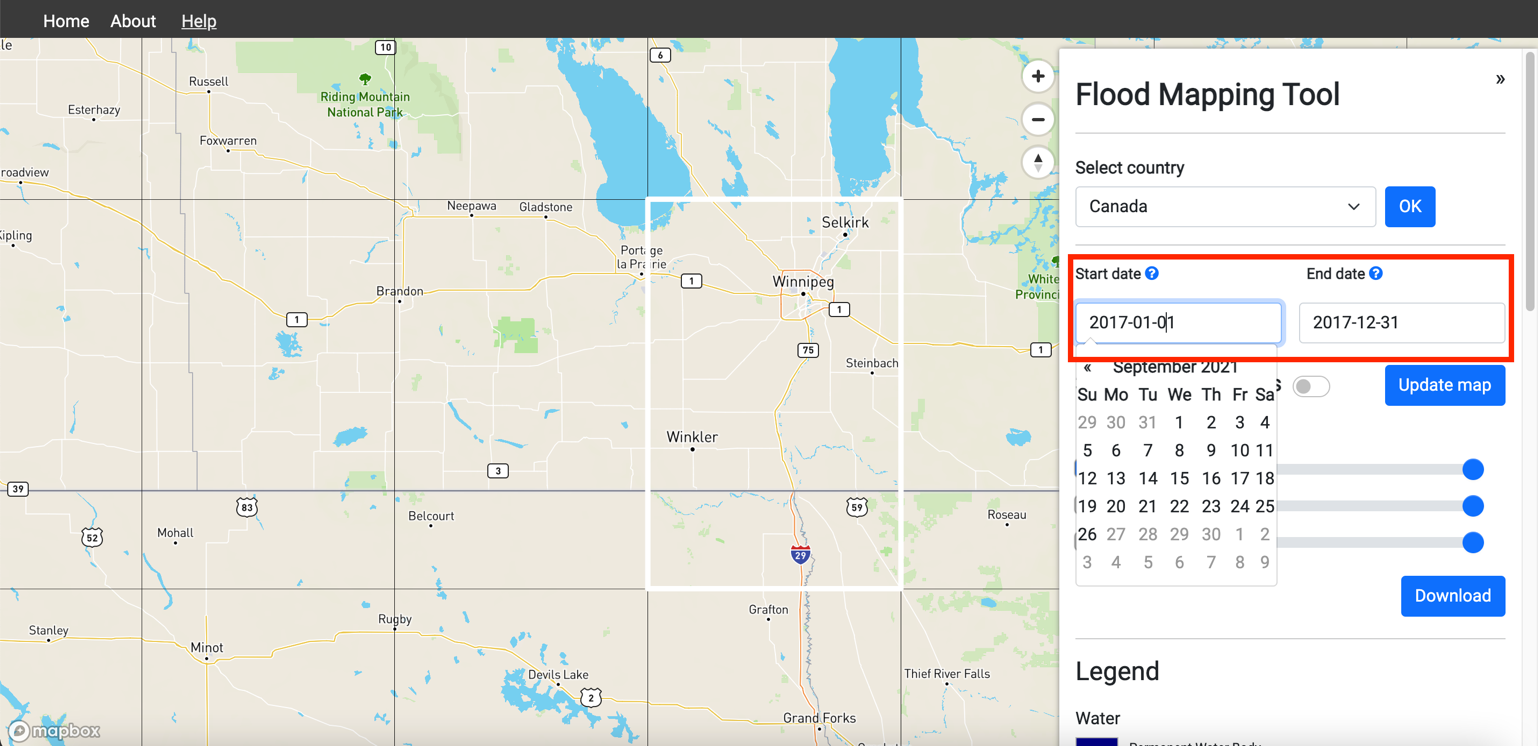
6. Select the Pre-Flood Start Date and Pre flood End Date to set the flood event duration.
7. Enter the NDWI Value within the range of 0 to 1.
8. Select the start date and end date on the options panel to set the flood event duration.
Add 30-45 days to the start date before the flood event and another 30-45 days to the end date after the flood events. This will help the flood mapping algorithm to pick up inundated areas with better accuracy.
9. Enter Backscattering value within the range of -18 to -23
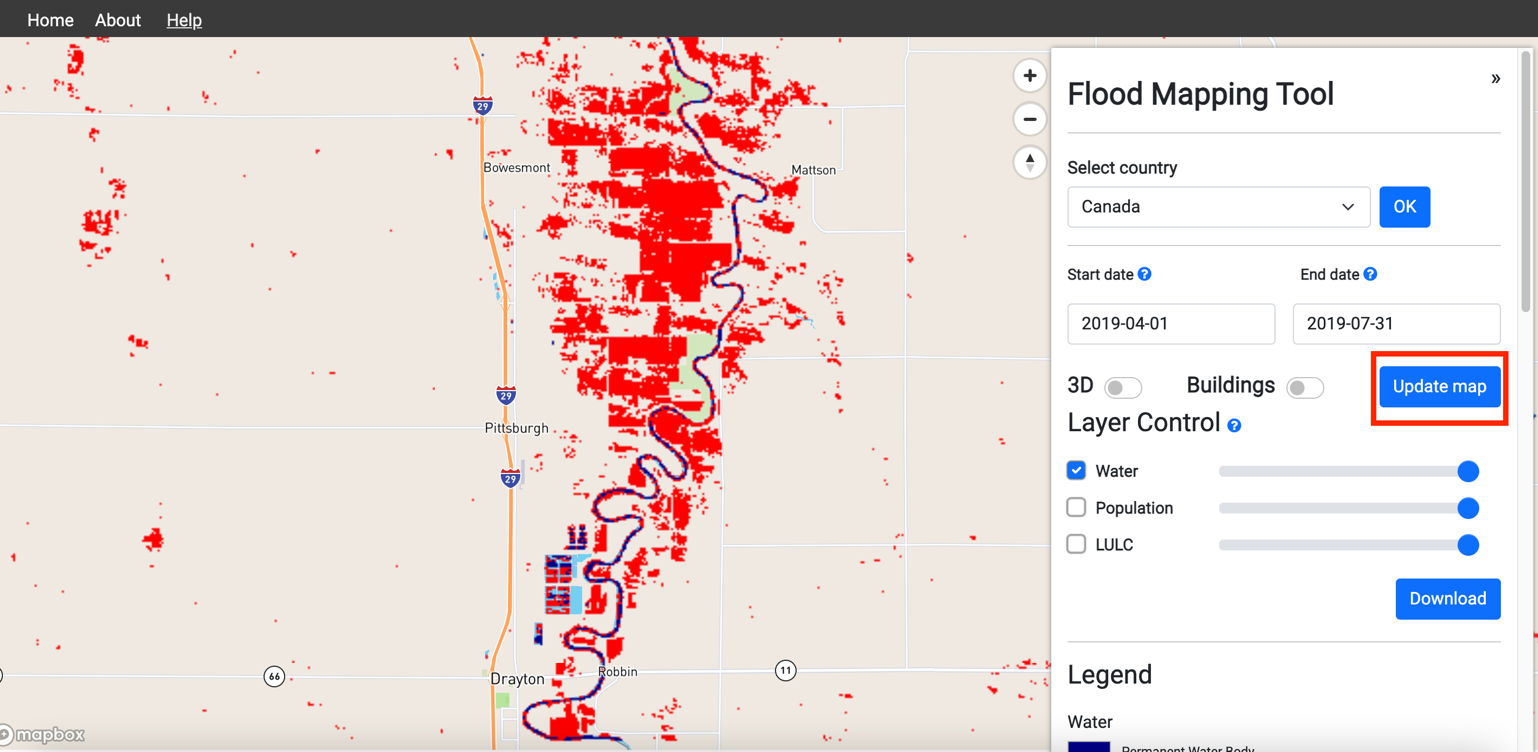
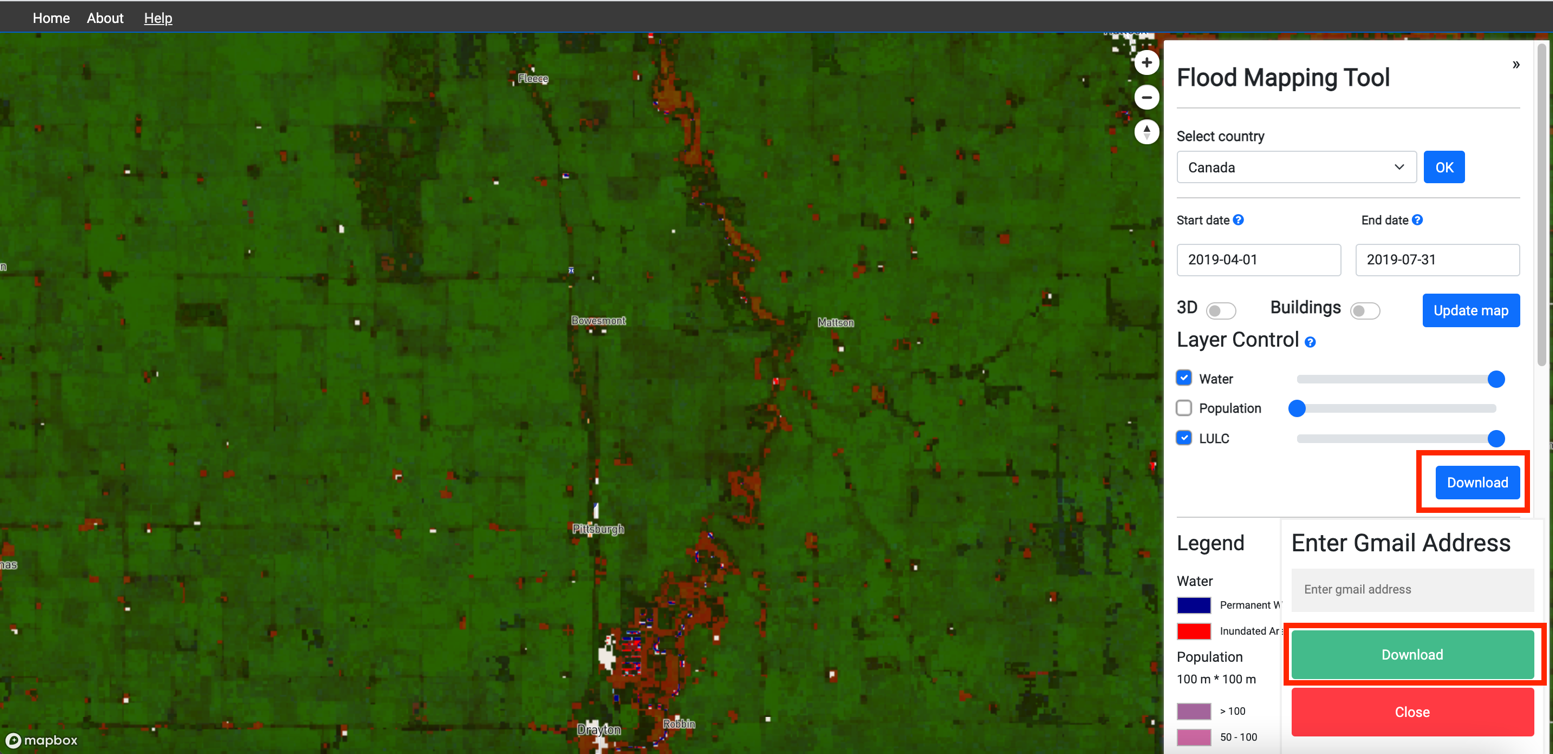
10. On the options panel, Click update map to view inundated areas.

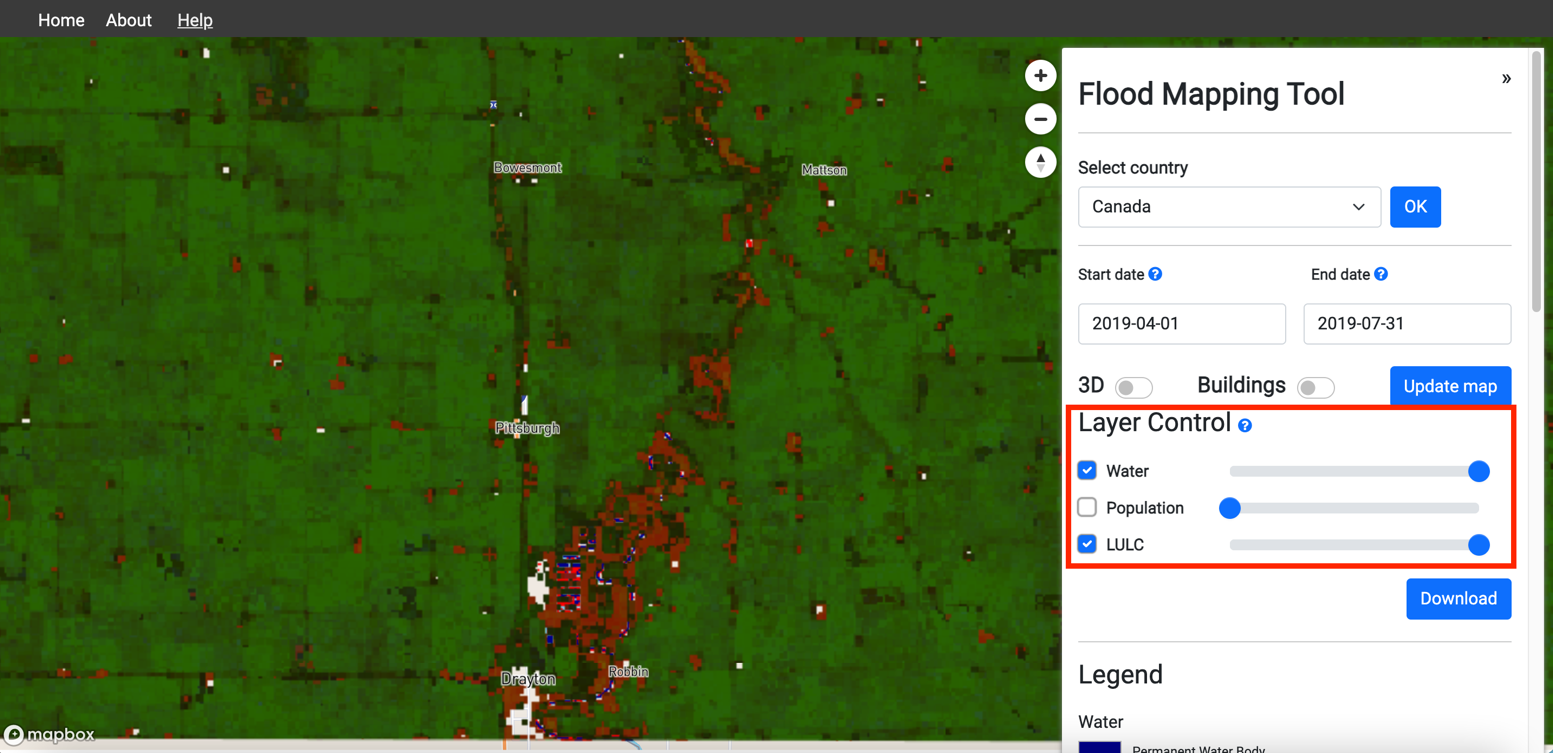
11. On the options panel, Click Checkboxes to turn on the water layer, use the sliders to adjust the transparency.

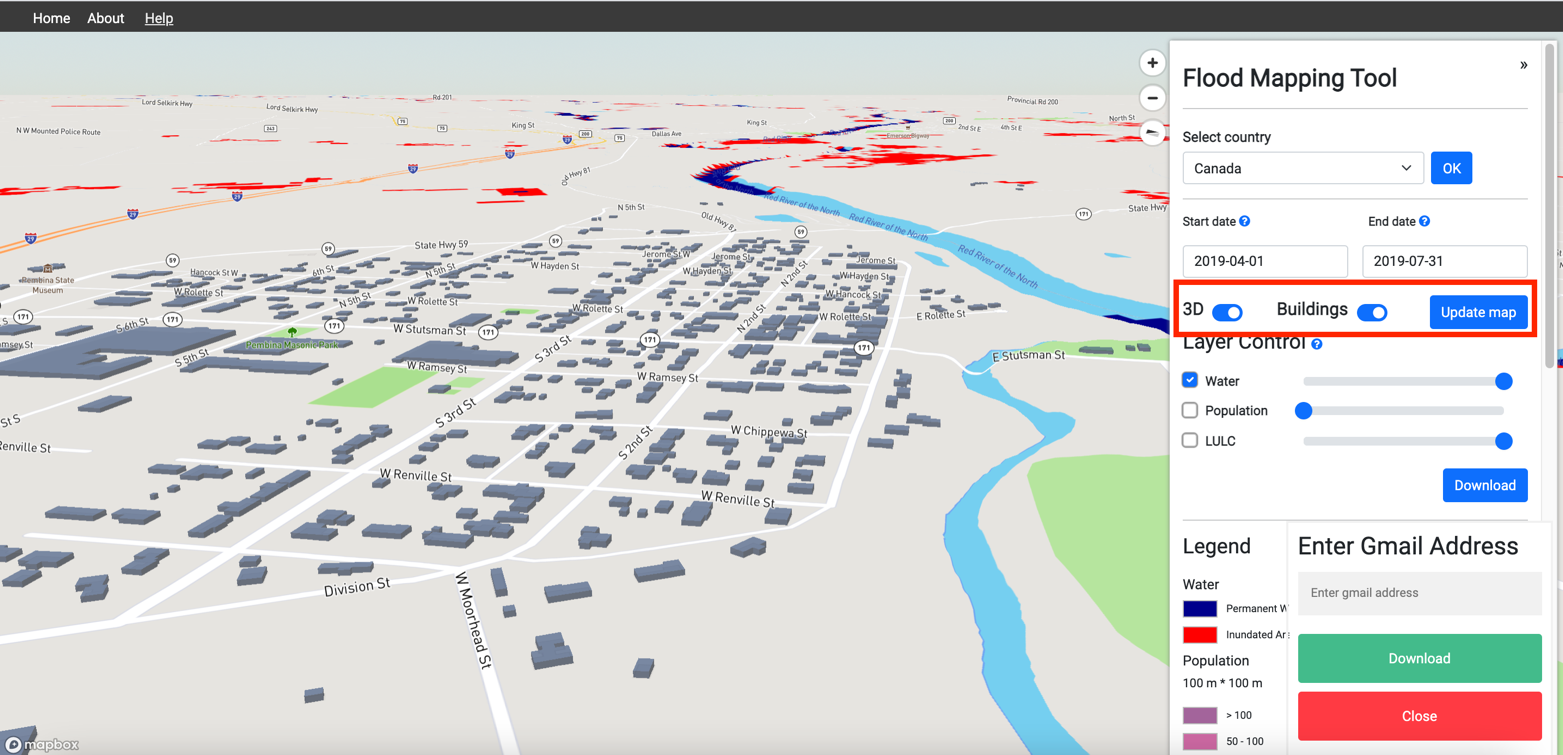
12. Use the Toggle button on the options panel to enable 3D view (hold CTRL when clicking and dragging to tilt and rotate the map).

Proceeding with the tool: Time series analysis of inundated areas
1. After selecting the “Select country”, click on the grid boundary to select the area of interest. The boundary color of the selected grid cell will change from black to white. Select the tool

2. Select the start date and end date on the options panel to set the flood event duration.

3. On the options panel, Click update map to view inundated areas.

13. Use the Toggle button on the options panel to enable 3D view (hold CTRL when clicking and dragging to tilt and rotate the map).

4. Adjust the layer control for transparency of the water layer

5. Choose variable to graph from Temperature, Precipitation and Population

6. Click the “Update graph” to get the variable graph for the selected variable

7. Expand the graph to a new tab by clicking onto the circled button

8. Click on the point to read the values specific to the date

Proceeding with the tool: Flood frequency analysis
1. After selecting the “Select country”, click on the grid boundary to select the area of interest. The boundary color of the selected grid cell will change from black to white. Select the tool.

2. Choose the sensor depending on the period considered of the flood time period.

3. Select the flood event date (Date when peak inundation is expected)

4. Enter the start date and end date of the flood inundated period.

5. Enter the cloud coverage.

6. Enter the slope in degrees

7. On the options panel, Click update map to view inundated areas.

8. Adjust the layer control for transparency of the water layer

9. Use the Toggle button on the options panel to enable 3D view (hold CTRL when clicking and dragging to tilt and rotate the map).

Acknowledgments and further reading
Acknowledgments:
- Google for their in-kind support under their Google Cloud for Researchers program
- MapBox for their in-kind under the Education program
- This tool has been jointly developed by the United Nations Economic and Social Commission for Asia and the Pacific and Institute for Water, Environment and Health
Developers:
Hamid Mehmood, Duminda Perera, Sami Kurani, and Crystal Conway
Further reading:
Mapping of Flood Areas Using Landsat with Google Earth Engine Cloud PlatformA 30 m Resolution Surface Water Mask Including Estimation of Positional and Thematic Differences Using Landsat 8, SRTM and OpenStreetMap: A Case Study in the Murray-Darling Basin, Australia
High-resolution mapping of global surface water and its long-term changes
Enhancing Resilience to Flood Disasters Through the Use of AI, Cloud Computing, and Open Datasets
Flood mapping tool (FMT) is the first tool released as part of the Web-based Spatial Decision Support System (WSDSS) to address flood-related information gaps in the currently available flood early warning and risk management systems. The WSDSS comprises FMT and a flood risk prediction tool (FRPT).
The FMT generates inundation maps for significant floods from 1984 till the present using open Earth data. The tool applies a water classification algorithm to 'stacks' of historical satellite imagery derived from Landsat to reveal inundation patterns over space and time. FMT is a hindcast tool that allows impacts of inundation on various socio-economic sectors to be analyzed.
The FRPT to be released in 2022 will use AI models to generate current and future flood risk maps for three climate change scenarios at the city, district, and river basin levels. The AI models will be trained using the inundation maps generated by the FMT and open datasets, including land use, land cover, precipitation, temperature, gender, and age-disaggregated socio-economic data.
WSDSS will improve the spatial and temporal coverage of national and regional flood early warning and risk management systems and enhance the spatial resolution of the outputs WSDSS will build the capacity of flood forecasting centers in Global South to use AI models, big data and, cloud computing to analyze the impacts of climate change.
Benefits of using WSDSS:
WSDSS will differ from the available systems in a number of ways; it will:
- Improve the resolution of the inundations maps to 30 m, enabling analysis to be performed at the city level.
- Focus on Global South as a whole, where the data and information gaps are prominent and annual losses due to floods are high.
- Improve the accuracy of the inundation maps by using data from multiple satellite sensors (harmonized Landsat Sentinel-2 data)
- Improve accuracy and development time of flood risk maps by using AI models.
Acknowledgments:
- Google for their in-kind support under their Google Cloud for Researchers program
- MapBox for their in-kind under the Education program
- This tool has been jointly developed by the United Nations Economic and Social Commission for Asia and the Pacific and Institute for Water, Environment and Health
Partners:
UN Partners: UNESCO Madanjeet Singh Centre for South Asia Water Management Sri Lanka
Government: Water Resources Research and Development Centre Nepal and Directorate of Planning, Bangladesh
Private Sector: Google and MapBox
Research Centers: Asian Disaster Preparedness Center Thailand and Network of Disaster Management Practitioners Pakistan
Academia: McMaster University Canada and International Institute of Information Technology India
Contact:
mir.matin@unu.edu
Further reading:
Mapping of Flood Areas Using Landsat with Google Earth Engine Cloud PlatformA 30 m Resolution Surface Water Mask Including Estimation of Positional and Thematic Differences Using Landsat 8, SRTM and OpenStreetMap: A Case Study in the Murray-Darling Basin, Australia
High-resolution mapping of global surface water and its long-term changes